Table of Contents
In this article, I will outline a method for extracting shoreline from satellite images in Google Earth Engine. This method is scalable and automatically extracts the coastline as a vector polyline. The full code link is available at the end of the post.
The method involves the following steps
- Create a Cloud-free Composite Image from images collected during the same tidal phase
- Extract All Waterbodies
- Remove Inland Water and Small Islands
- Convert Raster to Vector
- Simplify and Extract Coastline
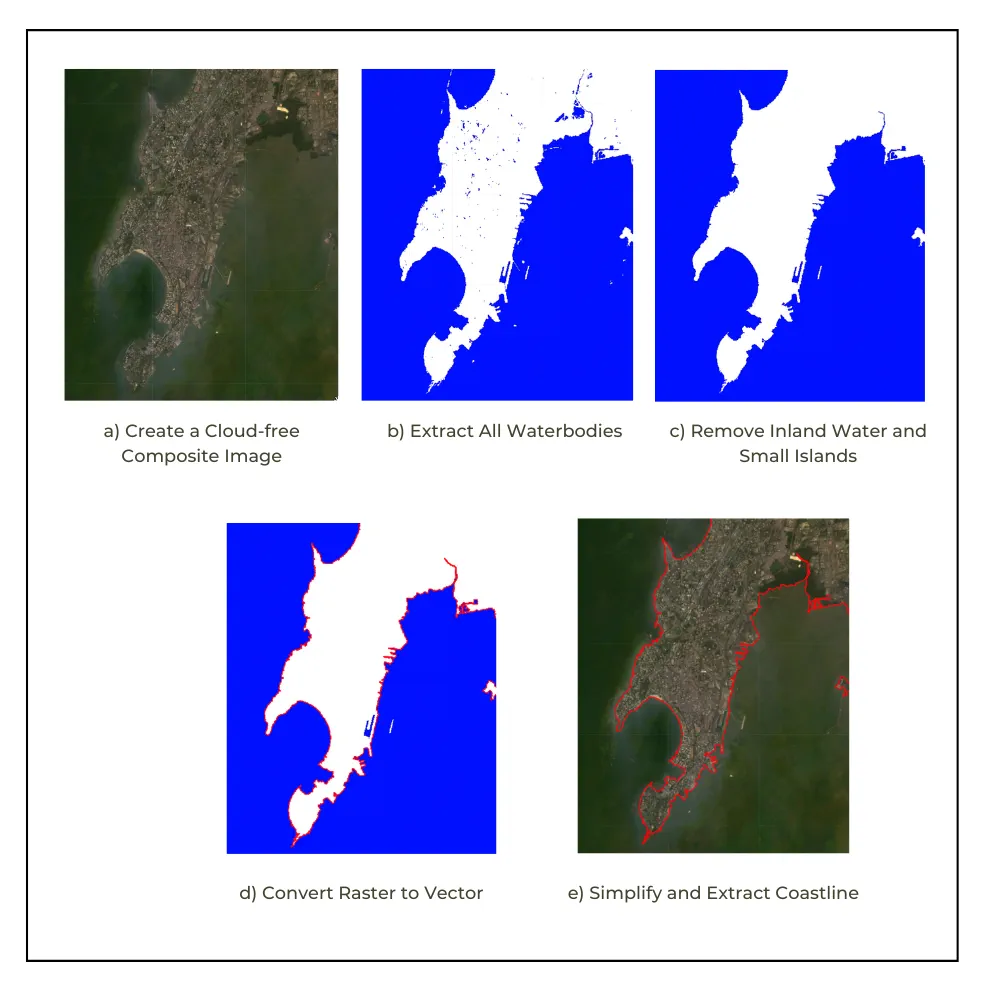
We will go through the details of each step and review the Google Earth Engine API code required to achieve the results.
Create a Cloud-free Composite Image
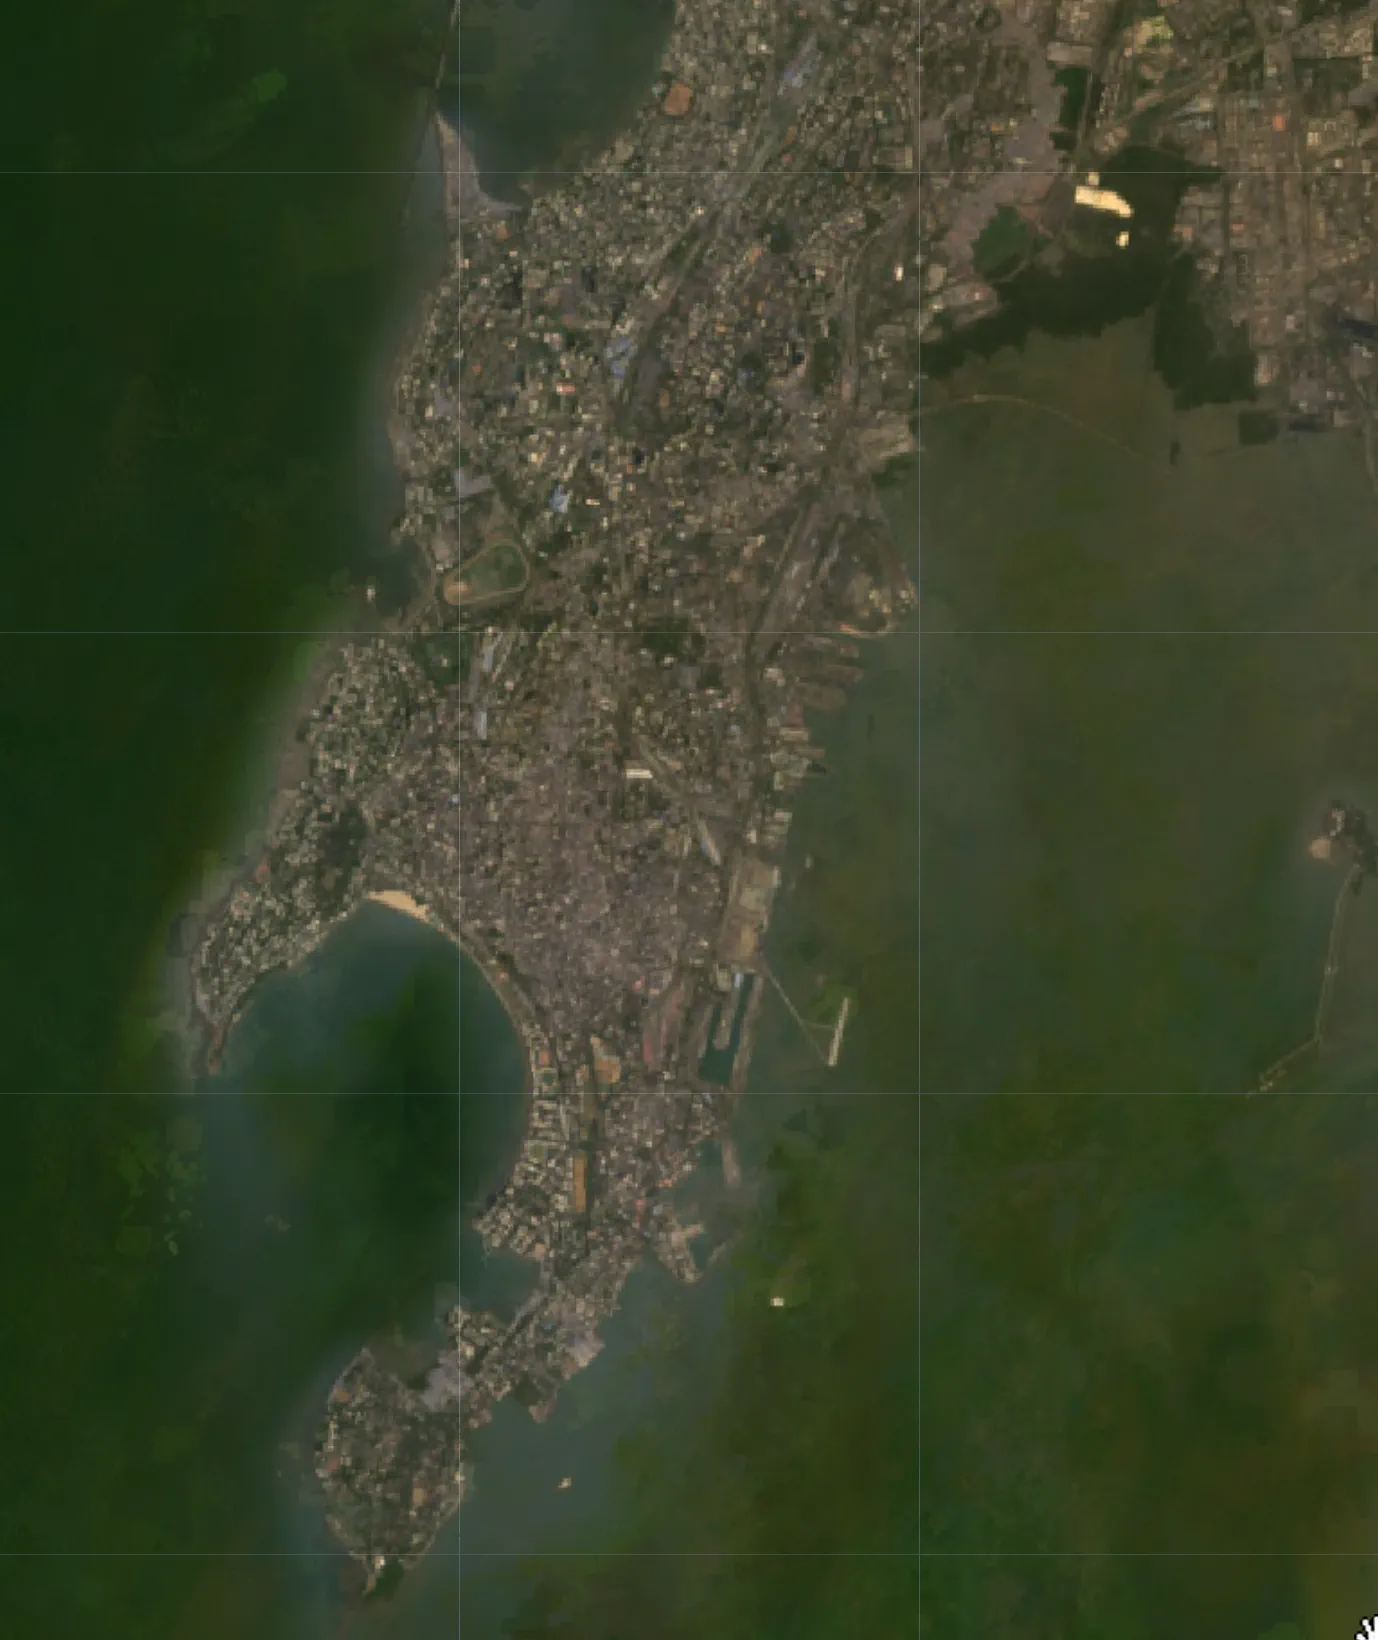
To be able to detect the shoreline correctly, we need cloud free images. The recommended way to do this is to create a composite image. You can select a suitable date range (monthly/yearly), apply a cloud mask to remove cloudy pixels and then create a median composite to achieve a cloud-free image. You can use any multispectral sensor to extract coastline. It is useful to have at least a NIR band and preferably a SWIR band to detect water reliably. Landsat and Sentinel-2 are the most widely used datasets for this task.
In this example, we start with Landsat Level 2 (Surface Reflectance) collection, filter to images collected during the chosen year and intersecting the region. Apply a functcloud mask to remove cloudy pixels.
// Define parameters
var startDate = ee.Date('2020-01-01');
var endDate = startDate.advance(1, 'year');

var collection = ee.ImageCollection('LANDSAT/LC08/C02/T1_L2')
  .filter(ee.Filter.date(startDate, endDate))
  .filter(ee.Filter.bounds(geometry));
Next, we apply a function that masks cloudy pixels and applies the scale/offset values.
// Apply a cloud mask
var maskL8sr = function(image) {
  var qaMask = image.select('QA_PIXEL')
    .bitwiseAnd(parseInt('11111', 2)).eq(0);
  var saturationMask = image.select('QA_RADSAT').eq(0);

  // Apply the scaling factors to the appropriate bands.
  var opticalBands = image.select('SR_B.')
    .multiply(0.0000275).add(-0.2);
  var thermalBands = image.select('ST_B.*')
    .multiply(0.00341802).add(149.0);

  // Replace the original bands with the scaled ones
  // and apply the masks.
  return image.addBands(opticalBands, null, true)
      .addBands(thermalBands, null, true)
      .updateMask(qaMask)
      .updateMask(saturationMask);
};
collection = collection.map(maskL8sr);

// Select and Rename Bands
collection = collection.select(
  ['SR_B2', 'SR_B3', 'SR_B4', 'SR_B5', 'SR_B6', 'SR_B7'],
  ['blue',  'green', 'red',   'nir',   'swir1', 'swir2']
);
Calculating Tidal Statistics
A median composite of all images from a year will represent the average coastline position from all observations, including high and low tides. Such composites are not suitable for comparing changes in the coastline over multiple years. To compare changes over time, you must ensure that the images are in the same phase of the tide. You can read this paper for an approach to mask high and low tide pixels. Alternatively, we can use tidal estimates and select images that are captured in the same phase of the tide. We have provided code that gives you the flexibility in how you select the images.
We use the HYCOM Sea Surface Elevation dataset to calculate tidal statistics and select images from the same tidal phase.
// Apply Tidal filtering using HYCOM data
var hycom = ee.ImageCollection('HYCOM/sea_surface_elevation')
    .filter(ee.Filter.bounds(geometry))
    .filter(ee.Filter.date(startDate, endDate))
    .select('surface_elevation');

// The pixels values have a scale factor of 0.001
// Scale the values to get tidal heights in meters
hycom = hycom.map(function(image) {
  return image.multiply(0.001).copyProperties(image,
    ['system:time_start']);
  });

// Time window for matching Landsat images with HYCOM tidal data
// HYCOM provides data every 3 hours, so ±3 hours ensures we find a match
// while staying within the same tidal phase (since tidal cycles are ~12.4 hours)
// Adjust if needed: smaller window (±1.5 hrs) = stricter, larger (±6 hrs) = more lenient
var tidalMatchWindowHours = 3;

// Function to get tidal statistics for the AOI
function getTidalStats(geometry, startDate, endDate) {

  // Calculate mean tidal elevation over the region
  // HYCOM images are masked over land, so this calculates
  // the mean elevation over the ocean pixels in the region
  var tidalStats = hycom.map(function(image) {
    var meanElevation = image.reduceRegion({
      reducer: ee.Reducer.mean(),
      geometry: geometry,
      scale: 9000, // HYCOM native resolution
      maxPixels: 1e9
    }).get('surface_elevation');

    return image.set('mean_elevation', meanElevation);
  });

  return tidalStats;
}

// Function to determine tidal phase thresholds
function getTidalThresholds(tidalStats) {
  var elevations = tidalStats.aggregate_array('mean_elevation');

  // Calculate statistics separately
  var minMax = ee.Dictionary(elevations.reduce(
    ee.Reducer.minMax()));
  var percentiles = ee.Dictionary(elevations.reduce(
    ee.Reducer.percentile([25, 50, 75])));

  return ee.Dictionary({
     'min': minMax.get('min'),
     'max': minMax.get('max'),
     'p25': percentiles.get('p25'),
     'p50': percentiles.get('p50'),
     'p75': percentiles.get('p75')
   });
}
// Function to add tidal elevation to each image
function addTidalElevation(imageCollection, geometry) {
  return imageCollection.map(function(img) {
    var imgDate = img.date();

    var tidalMatchStart = imgDate.advance(-tidalMatchWindowHours, 'hour');
    var tidalMatchEnd = imgDate.advance(tidalMatchWindowHours, 'hour');
    // Find closest HYCOM image (within 3 hours)
    var hyCOMImg = hycom
      .filter(ee.Filter.date(tidalMatchStart, tidalMatchEnd))
      .first();

    var meanElevation = hyCOMImg.reduceRegion({
      reducer: ee.Reducer.mean(),
      geometry: geometry,
      scale: 9000,
      maxPixels: 1e9
    }).get('surface_elevation');

    return img.set('tidal_elevation', meanElevation);
  });
}

// Get tidal statistics
print('Getting tidal statistics...');
var tidalStats = getTidalStats(geometry, startDate, endDate);
var thresholds = getTidalThresholds(tidalStats);
print('Tidal Thresholds:', thresholds);

// Add tidal elevation to all images
collection = addTidalElevation(collection, geometry);

// Extract threshold values
var minElev = ee.Number(thresholds.get('min'));
var maxElev = ee.Number(thresholds.get('max'));
var p25 = ee.Number(thresholds.get('p25'));
var p75 = ee.Number(thresholds.get('p75'));

// Tolerance for tidal phase matching

// How to choose tolerance:
// Start with a 0 tolerange and increase if you do not get
// enough images
// - Small tidal range (<2m): Use 0.1-0.2m tolerance
// - Medium tidal range (2-4m): Use 0.2-0.5m tolerance
// - Large tidal range (>4m): Use 0.5-1.0m tolerance
var tidalTolerance = 0;
var toleranceNum = ee.Number(tidalTolerance);

// Create three collections for different tidal phases
// Low tide: below 25th percentile plus tolerance
var collectionLow = collection
  .filter(ee.Filter.gte('tidal_elevation', minElev))
  .filter(ee.Filter.lte('tidal_elevation', p25.add(toleranceNum)));

// High tide: above 75th percentile minus tolerance
var collectionHigh = collection
  .filter(ee.Filter.gte('tidal_elevation', p75.subtract(toleranceNum)))
  .filter(ee.Filter.lte('tidal_elevation', maxElev));

// Mid tide: between 25th and 75th percentiles
var collectionMid = collection
  .filter(ee.Filter.gte('tidal_elevation', p25))
  .filter(ee.Filter.lte('tidal_elevation', p75));

print('Total Images in the collection', collection.size());
print('Images at LOW tide:', collectionLow.size());
print('Images at HIGH tide:', collectionHigh.size());
print('Images at MID tide:', collectionMid.size());
We have enough images for low, mid, and high tide phases. Select the images for any one of the phase and create a median composite. This is the representative image for the given year that will be used to extract the land-water boundary.
// Select the collection
// Here we choose the collectionLow for low-tide images
// Change this to collectionHigh or collectionMid as needed
var selectedImages = collectionLow;
// Create a median composite and clip
var composite = selectedImages.median().clip(geometry);

var rgbVis = {
  bands: ['red', 'green', 'blue'],
  min: 0.0,
  max: 0.3
};
Map.addLayer(composite, rgbVis, 'Composite Image');
Extract All Waterbodies
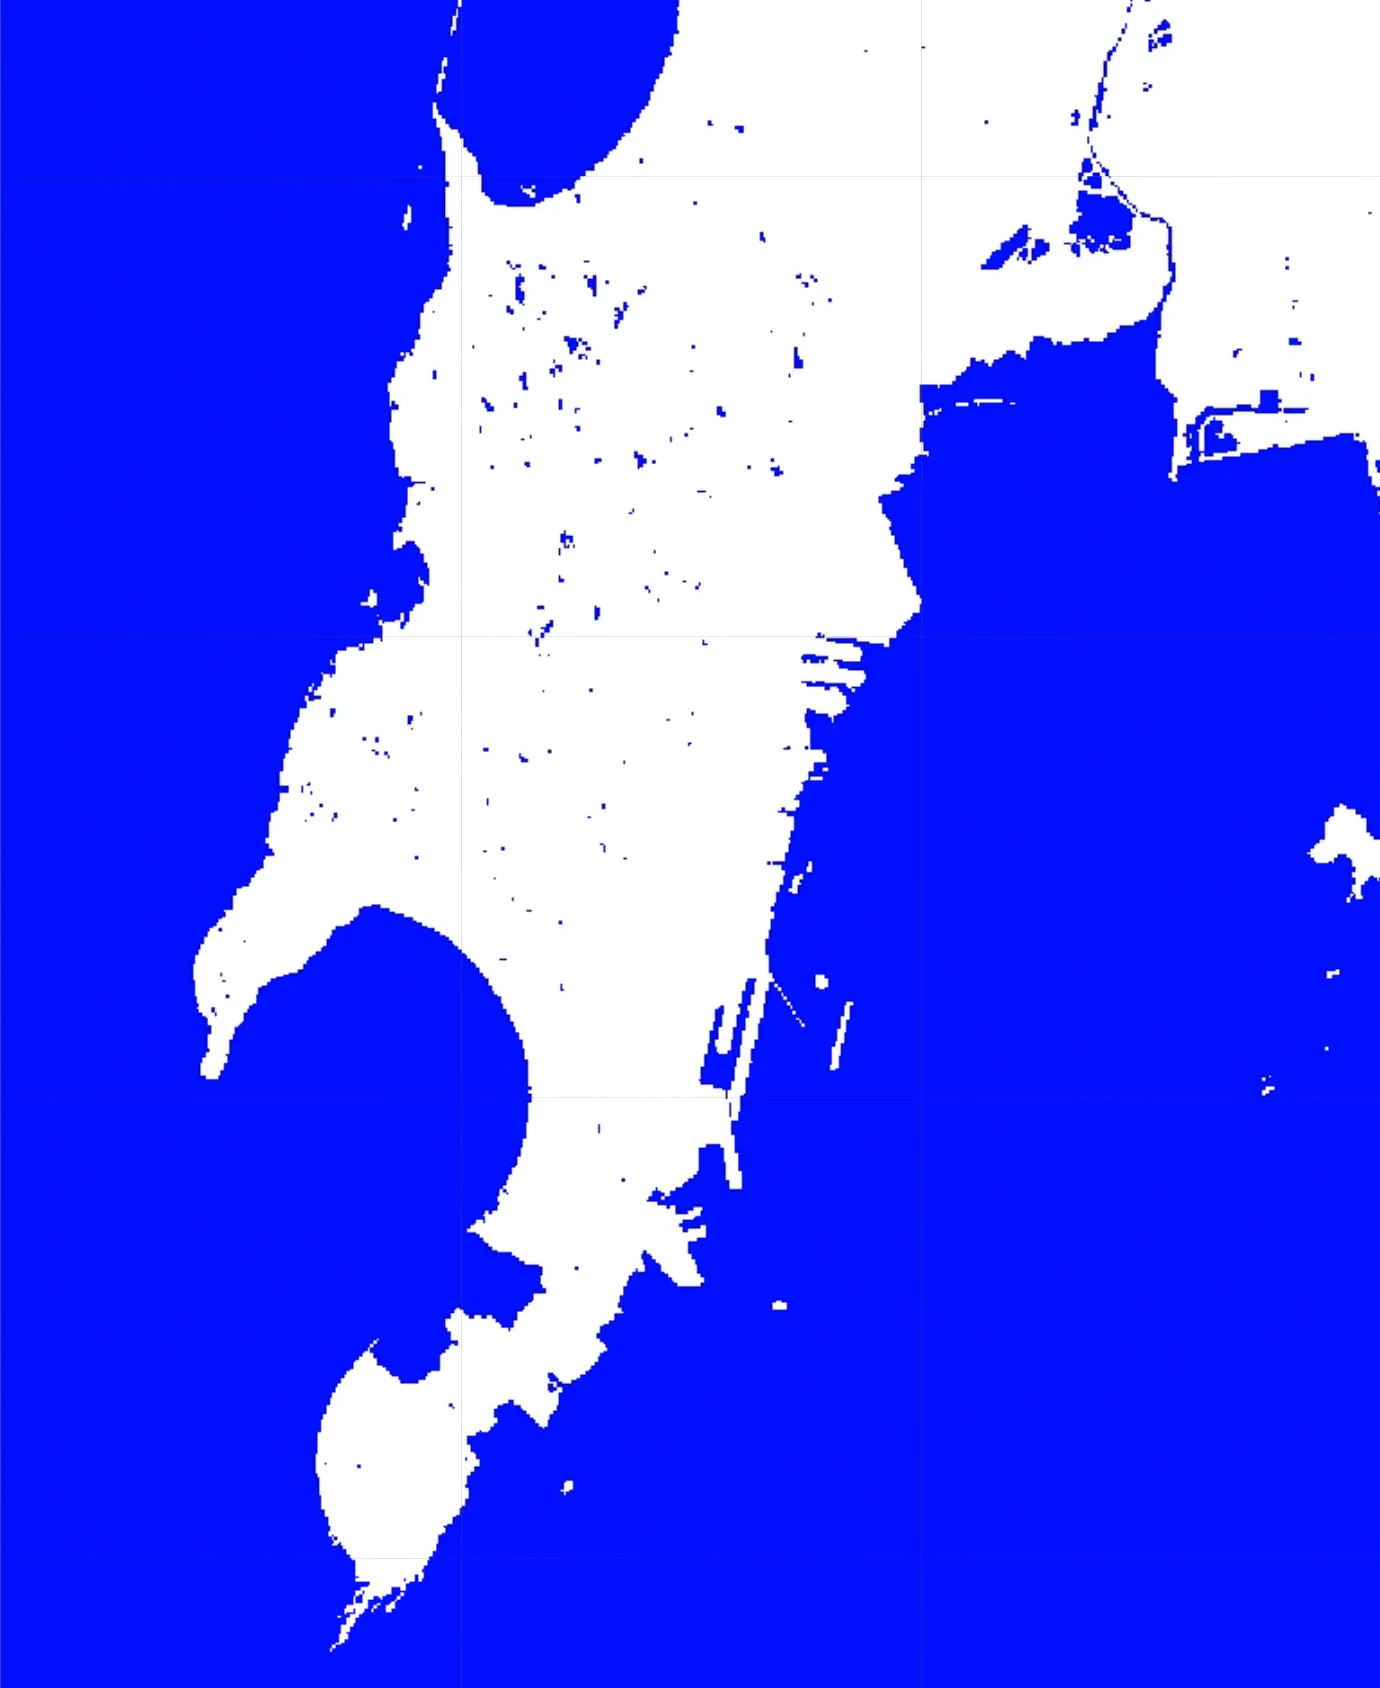
There are several methods for detecting and extracting surface water from satellite images. We want an automated method without needing to identify a threshold manually - so we will use Otsu Dynamic Thresholding. We will use the implementation from Gennadii Donchyts’s package users/gena/packages:thresholding.
Here we compute Automated Water Extraction Index (AWEI) and use Otsu Thresholding to find optimal threshold for water pixels in the given image. You may also try using other indices such as NDWI or MNDWI which may work better in your region of interest. If this method does not give satisfactory results, I recommend you look at Unsupervised Clustering method which combines different indices and uses machine learning approach to automatically identify water pixels.
// Code to compute AWEI and detect water
// using Otsu thresholding
var detectWater = function(image) {
  var awei = image.expression(
    '4 * (GREEN - SWIR1) - (0.25 * NIR + 2.75 * SWIR2)', {
      'GREEN': image.select('green'),
      'NIR': image.select('nir'),
      'SWIR1': image.select('swir1'),
      'SWIR2': image.select('swir2'),
  }).rename('awei');

  // Otsu Thresholding
  var thresholding = require(
    'users/gena/packages:thresholding');
  var scale = 100;
  var bounds = geometry;
  var cannyThreshold = 0.7;
  var cannySigma = 1;
  var minValue = -0.2;
  var th = thresholding.computeThresholdUsingOtsu(
    awei, scale, bounds,
    cannyThreshold, cannySigma, minValue);
  // Create a Land-Water Image using Otsu Threshold
  // You can replace th with a manual threshold if
  // Otsu results are not satisfactory
  var water = awei.gt(th).rename('water');

  return water;
};
var water = detectWater(composite);
var waterVis = {min:0, max:1, palette: ['white', 'blue']};
Map.addLayer(water, waterVis, 'All Water');
Remove Inland Water and Small Islands
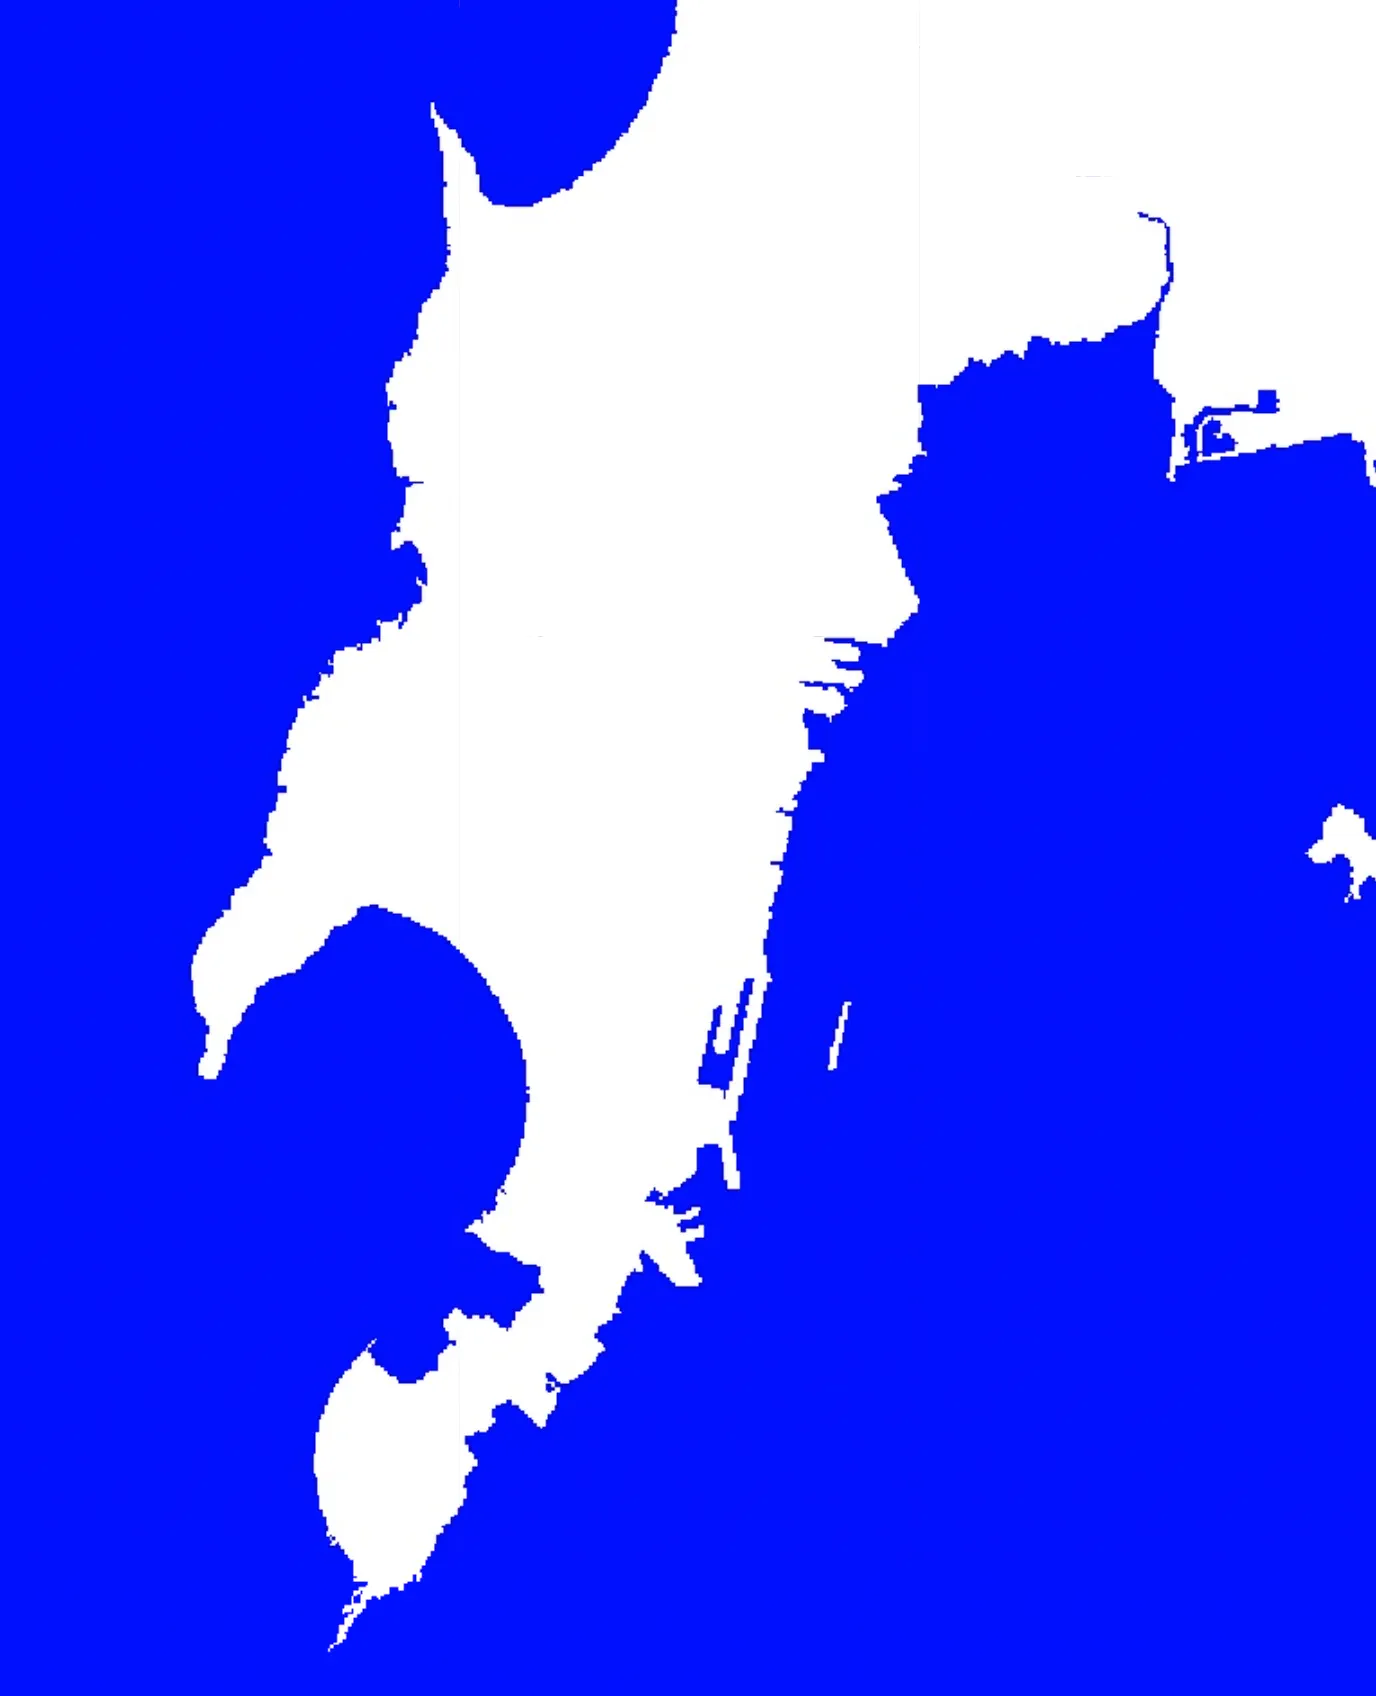
Our primary interest is the Land-Water Boundary, so we remove all inland waterbodies and small islands in the ocean. This is done by removing all clusters of water pixels smaller than a chosen size.
// Export resolution in meters is at which the coastline will
// be vectorized.
// Higher resolution (such as 10) will give smooother results
var exportResolutionMeters = 30;

// We need a threshold in meters to remove inland waterbodies
// and coastal islands. If you have a large waterbody close
// to the coastline, set this higher.
var waterbodySizeMeters = 2000;
var islandSizeMeters = 1000;

// This function takes a binary Land-Water image and
// removes inland water and small islands
function removeInlandWaterAndIslands(waterImage) {
  // reduceConnectedComponents expects an interger image
  waterImage = waterImage.int();

  // Define neighborhood based on user parameters
  var connectedPixelsLand = ee.Number(waterbodySizeMeters)
    .divide(exportResolutionMeters).int();

  var connectedPixelsWater = ee.Number(islandSizeMeters)
    .divide(exportResolutionMeters).int();

  // Remove inland water
  var landFilled = waterImage.addBands(waterImage)
   .reduceConnectedComponents(
     ee.Reducer.median(), 'water', connectedPixelsLand)
   .unmask(99).eq(99).and(waterImage.neq(0));

  // Remove small islands
  var waterFilled = landFilled.addBands(landFilled)
    .reduceConnectedComponents(
      ee.Reducer.median(), 'water_1', connectedPixelsWater)
    .unmask(99).eq(99).and(landFilled.neq(1));

  // Land-Water Boundary
  return waterFilled;
}
var landWaterBoundary = removeInlandWaterAndIslands(water);
var landWaterBoundaryVis = {
  min:0,
  max:1,
  palette: ['blue', 'white']
};

Map.addLayer(landWaterBoundary, landWaterBoundaryVis,
  'Land-Water Boundary (Raster)');
Convert Raster to Vector
Next, we vectorize the binary land-water image to obtain a polygon outline of the land area. This can also serve as the final output for many types of analysis. So you may export this as a shapefile and use it further.
// Convert the coastline image to vector
var vectors = ee.Image(landWaterBoundary).selfMask()
  .reduceToVectors({
    geometry: geometry,
    scale: exportResolutionMeters,
    eightConnected: true,
    maxPixels: 1e10,
    tileScale: 16
  });

Map.addLayer(vectors, {color: 'blue'},
  'Land-Water Boundary (Vector)');
Simplify and Extract Coastline
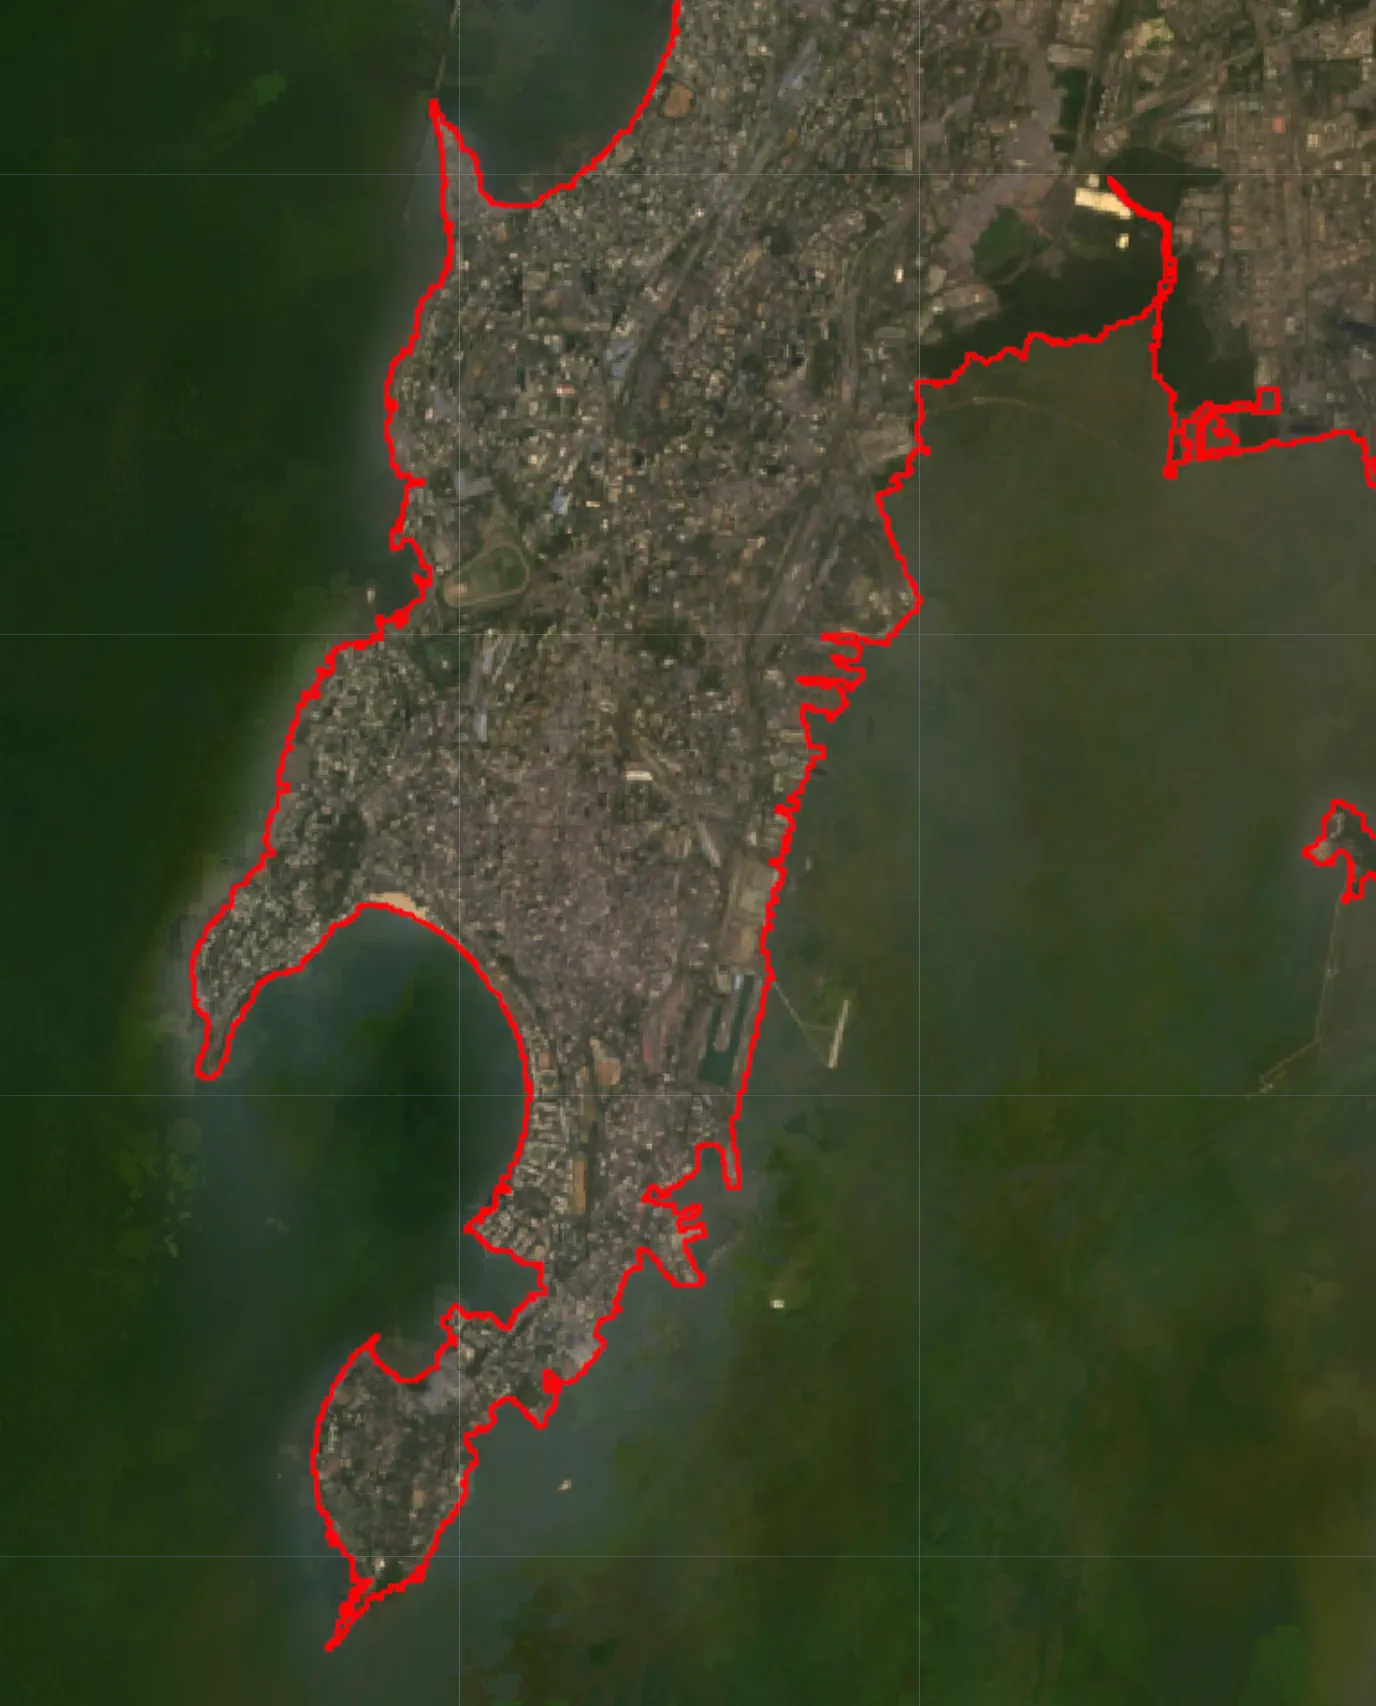
Many applications will require the resulting geometry as a line instead of polygon. So we take the resulting polygon, simplify it and extract the coordinates. We then use the coordinates to construct ee.Geometry.MultiLineString() features.
// This function takes vectorized polygons and
// extracts a polyline
var simplifyAndExtractCoastline = function(vectors){
  // Simplify vectors
  var processedVectors = vectors.map(function(f) {
    var coords = f.geometry()
      .simplify({maxError: exportResolutionMeters})
      .coordinates();

    // Buffer the geometry by a pixel to avoid rasterizing
    // the boundary polygon
    var bufferDistance = ee.Number(
      exportResolutionMeters).multiply(-1);
    return f
      .setGeometry(
        ee.Geometry.MultiLineString(coords)
          .intersection(geometry.buffer(bufferDistance)));
  });
  return processedVectors;
};

var coastlineVector = simplifyAndExtractCoastline(
    vectors);
Map.addLayer(coastlineVector, {color: 'red'},
  'Coastline (Vector)');
Export the Results
The code editor environment of GEE is limited to running interactive computations with a limit of 5 minutes. If you are trying to extract coastlines from a large region, you may you may get tile or memory errors. This simply means you can’t visualize the results interactively. To get your results in such cases, you have to Export the results. Exports can run for longer duration and have access to a larger pool of resources. You may export the results to Google Drive or even to your own Asset storage.
// Exports
// Exports can run for longer time and have more resources
// If any of your layers time-out or give tile errors,
// Run the exports instead
Export.table.toDrive({
  collection: coastlineVector,
  description: 'Extracted_Coastline_Vector',
  folder: 'earthengine',
  fileNamePrefix: 'coastline',
  fileFormat: 'SHP'})

Export.image.toDrive({
  image: landWaterBoundary,
  description: 'Extracted_Land_Water_boundary_Raster',
  folder: 'earthengine',
  fileNamePrefix: 'land_water_boundary_raster',
  region: geometry,
  scale: exportResolutionMeters,
  maxPixels: 1e10})

Export.image.toDrive({
  image: composite,
  description: 'Composite',
  folder: 'earthengine',
  fileNamePrefix: 'composite',
  region: geometry,
  scale: exportResolutionMeters,
  maxPixels: 1e10})
Here’s the full script for automated extraction of shoreline from Landsat images. You may use and adapt the code for different sensors or different methodologies.
If you are new to Earth Engine and want to learn how to apply it to such problems, check out my course Google Earth Engine for Water Resources Management.
Comments