The FOSS4G Asia 2026 conference was hosted at Nashik, India from 21-25 January 2026. This was a special event for me because I was part of the local organizing committee and worked alongside a passionate group of people to bring the open-source geospatial community together in India. The conference also co-hosted the State of the Map (SOTM) India 2026 gathering for the OpenStreetMap India community. In total, the event brought together 160+ attendees from India, Japan, Germany, Thailand, UK, UAE, Nepal, and Korea.
The Free and Open Source Software for Geospatial (FOSS4G) 2025 conference happened in Auckland, New Zealand from 17-23 November 2025. It was a week-long event with 2 days of workshops followed by 3 days of talks and networking sessions. I want to share my experience and resources in this post.
Geo for Good is Google’s annual conference focused on their geospatial and cloud offerings. The 2025 edition of the summit was hosted at both New York and Singapore. I was glad to take part in the Geo for Good 2025 Summit at Singapore that took place from Sept 8-11, 2025 at the Google Singapore office. The summit provided an excellent opportunity to learn about the latest advancements in Google’s geospatial tools and to build new professional connections.
The Conference
As Earth Engine gets more integrated with Google’s Cloud offerings, the focus of the conference has also shifted to interoperability and integration with other cloud services. Google has also invested a lot of resources into their AI offerings – particularly with the new Satellite Embedding dataset and it was at the center stage throughout the conference.
Geo for Good Singapore Summit Participants (Photo by Google)
I saw the following main themes in this year’s conference:
Theme 1: Interoperability
Theme 2: AI and Satellite Embedding Dataset
All the presentations shared during the summit are available on the Summit website and are linked from the ‘Resources’ section under the description of each session. While many of the sessions were recorded, they do not plan to release them to the public.
The QGIS International User Conference 2025 happened in Norrköping, Sweden from 2-3 June 2025. I have been to the previous conferences in 2024, 2023 and 2019 and always look forward to the annual event. The conference keeps getting bigger and this year it attracted a diverse audience of 300+ participants from around the globe.
Geo for Good is Google’s annual summit that brings together users of Google mapping tools. It’s usually a large conference hosted at Google HQ in Mountain View, California. This year however, they decided to split the conference into 2 mini summits – one in São Paulo, Brazil and another in Dublin, Ireland. I have been going to Geo for Good for many years and was glad to take part in the Geo for Good 2024 Mini Summit at Dublin. The summit was a 4-day long event that took place from Sept 23-26, 2024 at the Google Dublin office.
The Conference
Geo for Good started as way for the geospatial community to come together and celebrate social and environmental impact using Google’s mapping tools. The conference has now evolved into an Earth Engine focused event for both the Earth Engine community (research, education, non-profit) and Commercial users (Google Cloud customers).
Geo for Good Dublin Summit Participants (Photo by Alan Rowlette for Google)
I saw the following main themes in this year’s conference:
Theme 1: EUDR and Sustainable Sourcing of Commodities
The QGIS International User Conference 2024 happened in Bratislava, Slovakia from 9-10 September 2024, followed by the Contributor Meeting from 11-13 September 2024. This is one of my favorite events of the year and I have been to the previous conferences in 2023 and 2019 as well. The conference keeps getting bigger and this year it attracted a diverse audience of 240 participants from around the globe. This was also my first time attending the contributor meeting and got to spend an extended time with the developers and the community.
Dynamic World is a new landcover product developed by Google and World Resources Institute (WRI). It is a unique dataset that is designed to make it easy for users to develop locally relevant landcover classification easily. Contrary to other landcover products which try to classify the pixels into a single class – the Dynamic World (DW) model gives you the probability of the pixel belonging to each of the 9 different landcover classes. The full dataset contains the DW class probabilities for every Sentinel-2 scene since 2015 having <35% cloud-cover. It is also updated continuously with detections from new Sentinel-2 scenes as soon as they are available. This makes DW ideal for change detection and monitoring applications.
A key fact about this dataset is that Dynamic World is not a ready-to-use landcover product. Users are expected to fine-tune the output of DW with local knowledge into a final landcover product. Since DW provides per-pixel probabilities generated by a Fully Convolutional Neural Network (FCNN) model, a lot of difficult problems encountered in classifying remotely sensed imagery are addressed already and allows users to refine it with a relatively simple model (such as Random Forest) with small amount of local training data.
A good mental model to use for Dynamic World is to not think of it as landcover product but as a dataset that provides 9 additional bands of landcover related information for each Sentinel-2 image that can be refined to build a locally relevant classification or change detection model.
As seen in the mangrove classification example, using the Dynamic World probability bands as input to a supervised classification model can help you generate a more accurate landcover map in less amount of time. It also eliminates the need for post-processing the results.
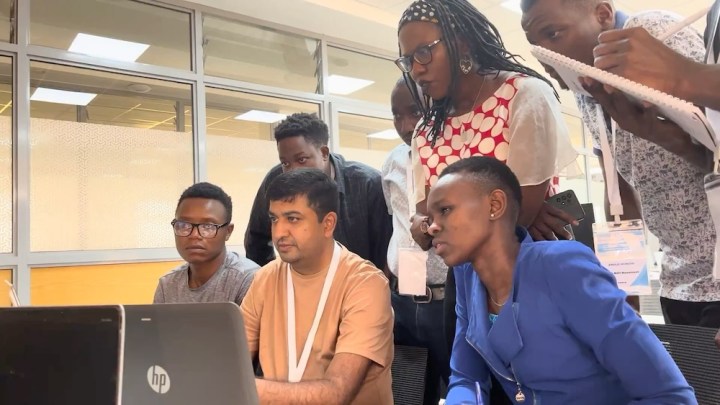
To test this concept and explore the potential of this new dataset in developing locally relevant landcover maps – I partnered with Google and WRI to develop a training workshop and host a 5-day “Mapathon” with participants of diverse backgrounds. The event was a mix of hands-on workshop along with hackathon-style group projects to use Dynamic World for a real-world application.
The workshop was hosted by Regional Centre for Mapping of Resources for Development (RCMRD) in Nairobi, Kenya. You can read more about the event in this article. I and Elise Mazur from WRI also gave a talk about our experience at Geo for Good 2023.
In this post, I want to share more technical details about the workshop materials and code for projects for those who may want to use Dynamic World for their own applications.
A long awaited community event that happened after a break of 3 years. The conference was attended by over 200 people from across the world. I got a chance to participate and meet many of QGIS community members in-person.
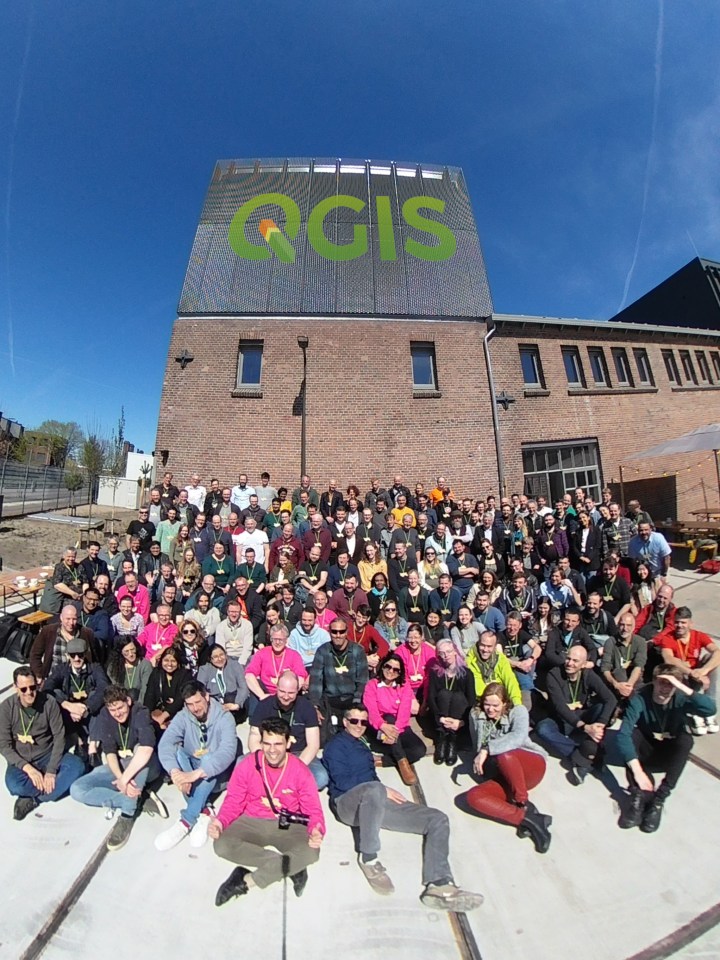
Conference Group Photo
In this post, I hope to share some of my insights and resources from the conference.
This was the meeting point of over 100 QGIS developers, users, and trainers from all over the globe. It was the first time I met the QGIS community in person, including some of the people whose work I have admired for years. The event took place over 3 days – 2 days of workshops and 1 day of talks. I am putting some of my notes, takeways and links to resources shared on other channels (twitter, telegram, email) for the benefit of folks who were not present
I recently attended the OpenAQ workshop in Delhi . The workshop’s goal was to bring tech, science and media folks working on air quality together and brainstorm how to use open data to tackle air pollution challenges. Below are my notes and links to materials presented during the workshop.
Below are my notes and links to materials presented during the workshop.