
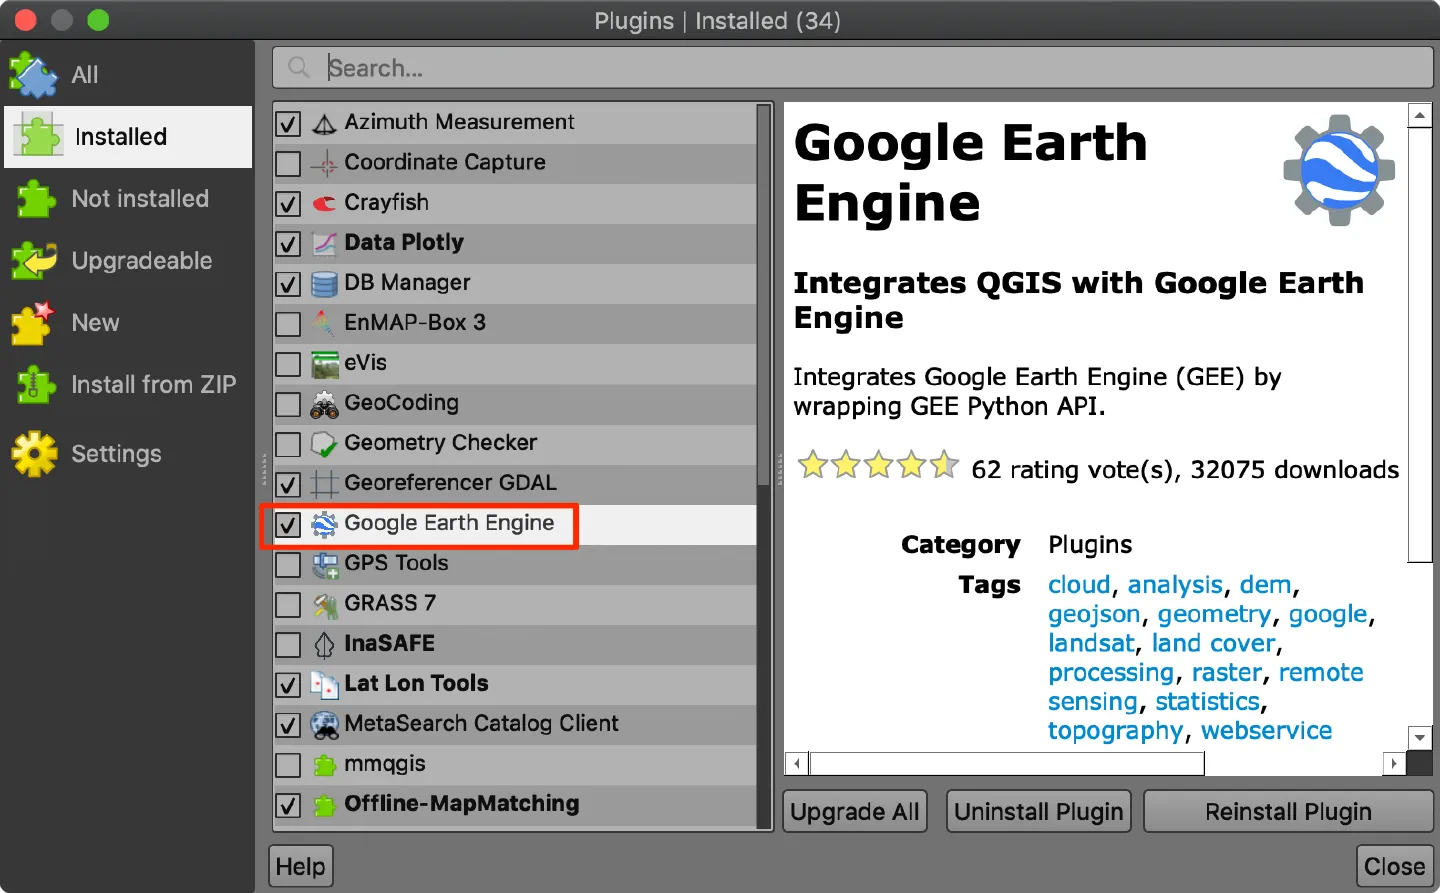
In QGIS, go to Plugins → Manage and Install Plugins and install the ‘Google Earth Engine’ plugin. After installation, you will be prompted to authenticate using your Google Earth Engine account.
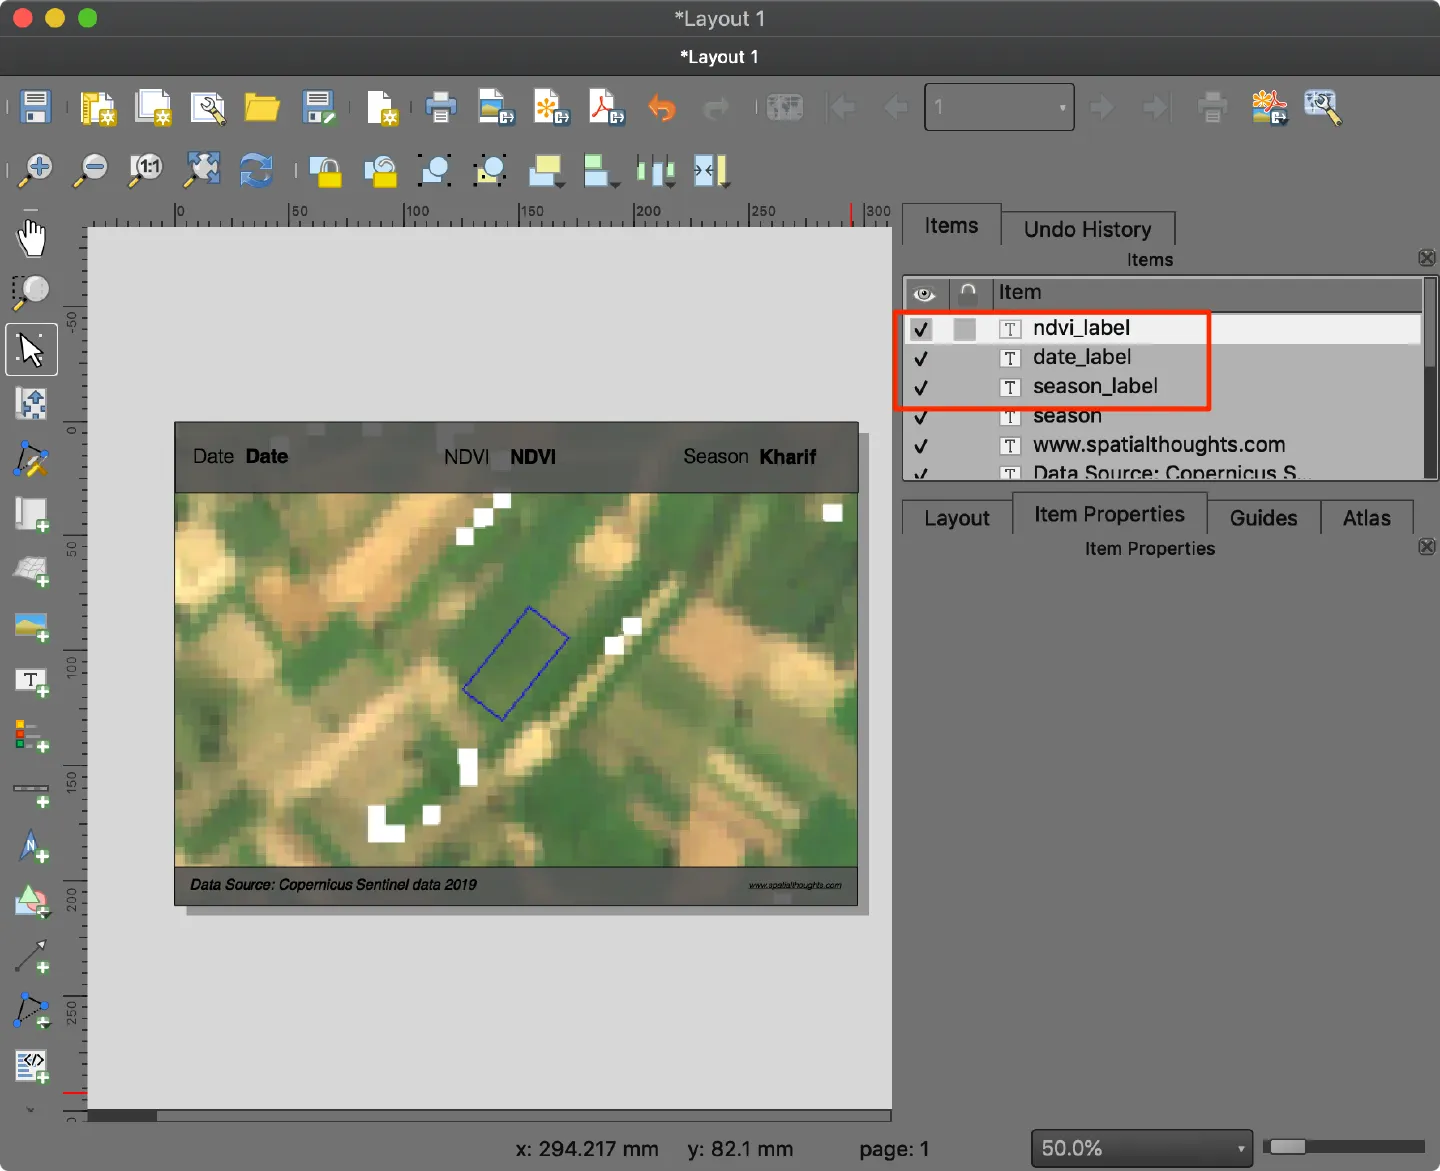
I prepared a map layout using the QGIS Print Layout and saved it as a template file. Download the template ndvi_map.qpt and save it to your Desktop. Note that for each frame of the animation, we will have to extract the image data and render the template with values for date_label, ndvi_label, and season_label.
We will use the Sentinel-2 Surface Reflectance (SR) data to compute the NDVI values for the year 2019 over a farm in northern India. The concept behind extracting the time series from an image collection is nicely demonstrated in this tutorial by Nicholas Clinton. This example adapts this code for Python and adds a few enhancements to pick images where 100% of farm area is cloud-free.
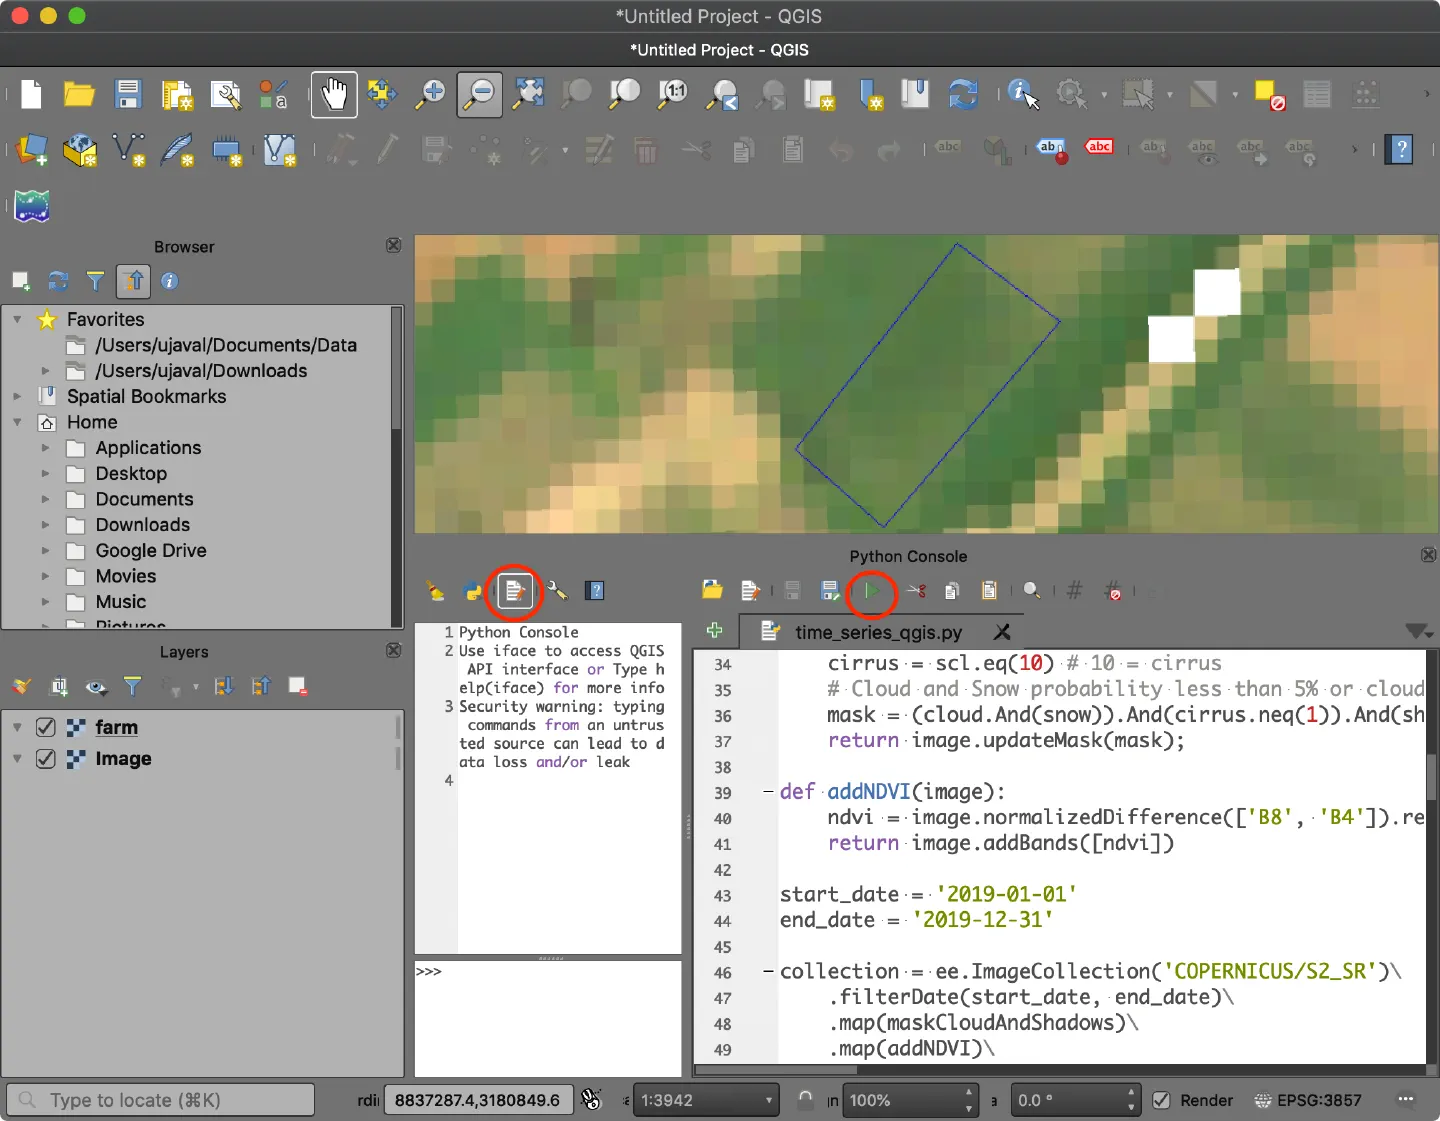
Earth Engine code integrates seamlessly with PyQGIS code. You can use the Earth Engine Python API just the way you would use it elsewhere in the Python Console. Open Plugins → Python Console. Click ‘Show Editor’ button to open the built-in editor. Copy/Paste the code below and click ‘Run’ to execute the code.
import ee
from ee_plugin import Map
import os
from datetime import datetime

# Script assumes you put the ndvi_map.qpt file on your Desktop
home_dir = os.path.join(os.path.expanduser('~'))
template = os.path.join(home_dir, 'Desktop', 'ndvi_map.qpt')

geometry = ee.Geometry.Polygon([[
    [79.38757620268325, 27.45829434648896],
    [79.38834214903852, 27.459092793050313],
    [79.38789690234205, 27.459397436737895],
    [79.38718343474409, 27.458592985177017]
    ]])
farm = ee.Feature(geometry, {'name': 'farm'})
fc = ee.FeatureCollection([farm])
Map.centerObject(fc)
empty = ee.Image().byte();
outline = empty.paint(**{
  'featureCollection': fc,
  'color': 1,
  'width': 1
});
viz_params = {'bands': ['B4', 'B3', 'B2'], 'min': 0, 'max': 2000}

def maskCloudAndShadows(image):
    cloudProb = image.select('MSK_CLDPRB')
    snowProb = image.select('MSK_SNWPRB')
    cloud = cloudProb.lt(5)
    snow = snowProb.lt(5)
    scl = image.select('SCL');
    shadow = scl.eq(3) #3 = cloud shadow
    cirrus = scl.eq(10) # 10 = cirrus
    # Cloud and Snow probability less than 5% or cloud shadow classification
    mask = (cloud.And(snow)).And(cirrus.neq(1)).And(shadow.neq(1))
    return image.updateMask(mask);

def addNDVI(image):
    ndvi = image.normalizedDifference(['B8', 'B4']).rename('ndvi')
    return image.addBands([ndvi])

start_date = '2019-01-01'
end_date = '2019-12-31'

collection = ee.ImageCollection('COPERNICUS/S2_SR')\
    .filterDate(start_date, end_date)\
    .map(maskCloudAndShadows)\
    .map(addNDVI)\
    .filter(ee.Filter.intersects('.geo', farm.geometry()))

def get_ndvi(image):
    stats = image.select('ndvi').reduceRegion(**{
        'geometry': farm.geometry(),
        'reducer': ee.Reducer.mean().combine(**{
            'reducer2': ee.Reducer.count(),
            'sharedInputs': True}
            ).setOutputs(['mean', 'pixelcount']),
        'scale': 10
        })
    ndvi = stats.get('ndvi_mean')
    pixelcount = stats.get('ndvi_pixelcount')
    return ee.Feature(None, {
        'ndvi': ndvi,
        'validpixels': pixelcount,
        'id': image.id(),
        'date': ee.Date(image.get('system:time_start')).format('YYYY-MM-dd')
      })


with_ndvi = collection.map(get_ndvi)
# Find how many pixels in the farm extent
max_validpixels = with_ndvi.aggregate_max('validpixels').getInfo()

def select_color(ndvi):
    ndvi_colors = {
        0.3: QColor('#dfc27d'),
        0.5: QColor('#c2e699'),
        1: QColor('#31a354')}

    for max_value, color in ndvi_colors.items():
        if ndvi < max_value:
            return color

def select_season(date_str):
    seasons = {
        'Kharif': [7, 8, 9,10],
        'Rabi': [11, 12, 1, 2, 3],
        'Summer': [4, 5, 6]
    }
    date = datetime.strptime(date_str, '%Y-%m-%d')
    month = date.month
    for season, months in seasons.items():
        if month in months:
            return season

features = with_ndvi.getInfo()['features']
for feature in features:
    ndvi = feature['properties']['ndvi']
    validpixels = feature['properties']['validpixels']
    date = feature['properties']['date']
    id = feature['properties']['id']
    # The following condition ensures we pick images where
    # all pixels in the farm geometry are unmasked
    if ndvi and (validpixels == max_validpixels):
        image = ee.Image(collection.filter(
            ee.Filter.eq('system:index', id)).first())
        Map.addLayer(image, viz_params, 'Image')
        Map.addLayer(outline, {'palette': '0000FF'}, 'farm')
        project = QgsProject.instance()
        layout = QgsLayout(project)
        layout.initializeDefaults()
        with open(template) as f:
            template_content = f.read()
        doc = QDomDocument()
        doc.setContent(template_content)
        # adding to existing items
        items, ok = layout.loadFromTemplate(doc, QgsReadWriteContext(), False)
        ndvi_label = layout.itemById('ndvi_label')
        ndvi_label.setText('{:.2f}'.format(ndvi))
        ndvi_label.setFontColor(select_color(ndvi))

        date_label = layout.itemById('date_label')
        date_label.setText(date)

        season = select_season(date)
        season_label = layout.itemById('season_label')
        season_label.setText(season)

        exporter = QgsLayoutExporter(layout)
        output_image = os.path.join(home_dir, 'Desktop', '{}.png'.format(date))
        exporter.exportToImage(output_image, QgsLayoutExporter.ImageExportSettings())
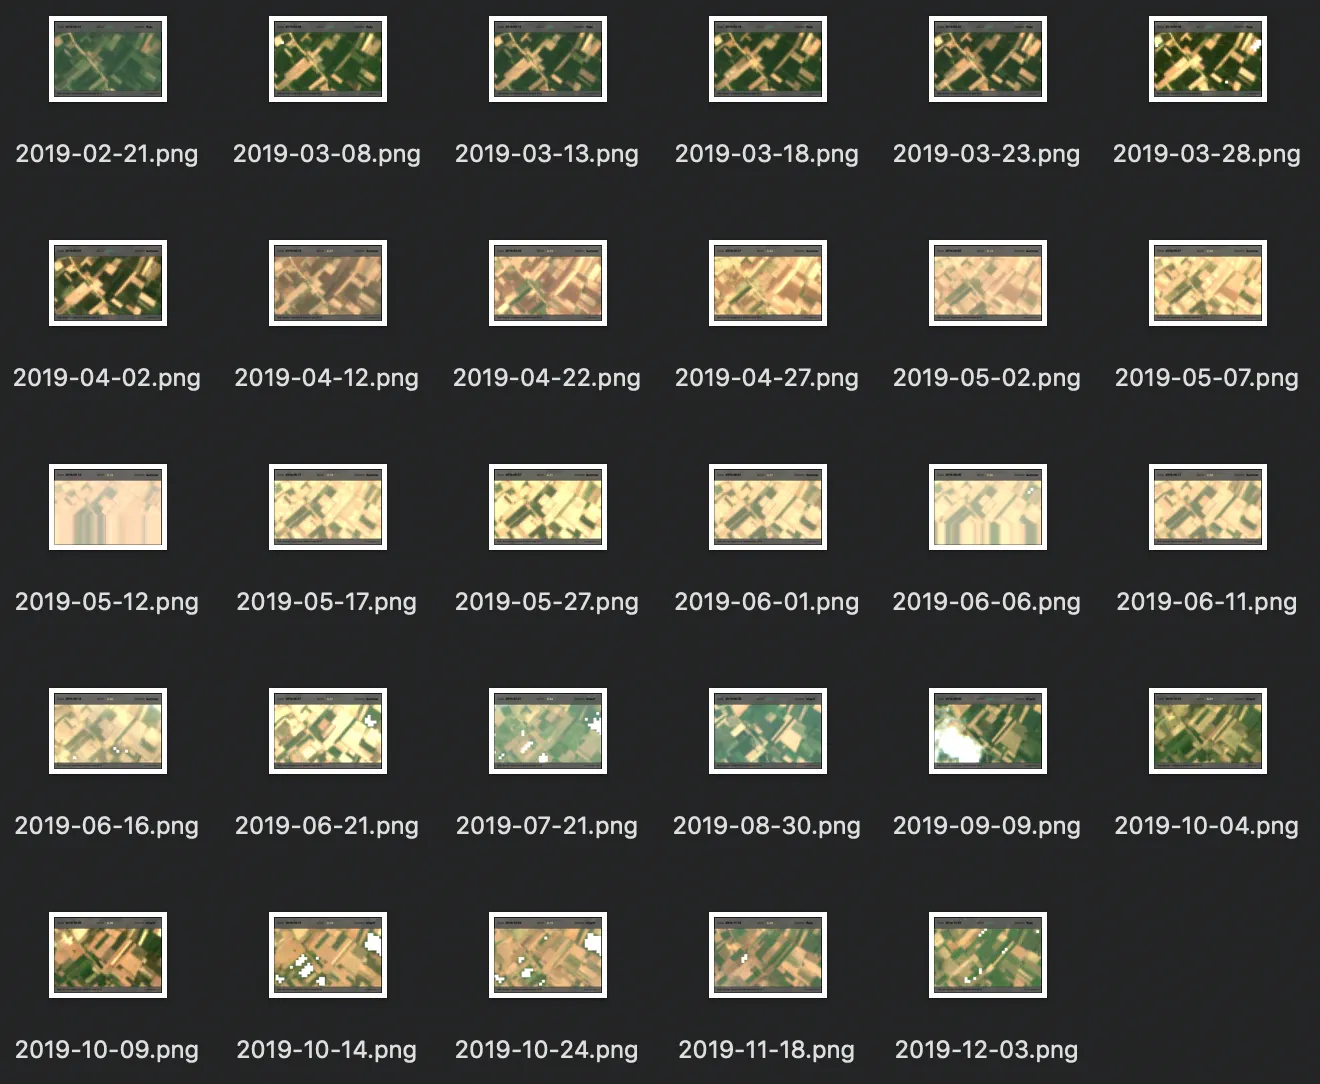
The script would iterate through each image and render the template with appropriate image and data. All of the processing is done in the cloud using Google Earth Engine and only the results are streamed to QGIS. If all went well, in a few minutes, the system would have crunched through Gigabytes of data and you will have a bunch of images on your desktop. You can animate them using a program like ezgif.com
Comments