

You may have seen a map where source and destination points are connected via curved lines. It is possible to create such a map in QGIS with a simple trick – using custom projections and densification of lines. I will outline the steps to create such a map.
The data I am using is a spreadsheet of participant’s location for the QGIS International User Conference 2019 in A Coruña, Spain. The idea was to create a map that shows the gathering of people flying from ‘source’ (their hometown) to the ‘destination’ (conference location).
The data for this task comes from QGIS User Conference 2019 Participants spreadsheet. I exported this as a CSV. Since the spreadsheet contains city names, we need to geocode it to create a point layer. I used the OpenStreetMap / Nominatim geocoding service via MMQGIS plugin in QGIS to create a point layer.

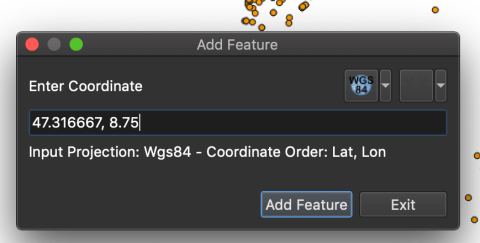
There were a few records which were not formatted properly and the service was not able to geocode them. For example ‘Grüt (Gossau ZH),Swizerland’. I fetched the coordinates for such locations from Wikipedia and used the Lat Lon Tools plugin to add those points manually to the geocoded layer.
I also created another layer with a single point for ‘destination’ which is the city of A Coruña, Spain. Now time to create the hub lines. The ‘Distance to Nearest Hub (Line to Hub)‘ processing algorithm came in handy to create the lines.


The lines are straight lines from source to destination as expected. To make the lines curved, we need to first add more vertices on the lines between the source and destination. I used the ‘Densify by Count‘ algorithm to add 10 points on each line feature.

Lines that are straight in one projections, appear curved in another. If we set the project to a projection such as Azimuthal Orthographic – where straight lines appear as great circles – the hub lines will be curved. I added a custom CRS in QGIS, defined as a orthographic projection centered around Spain.
+proj=ortho +lat_0=43.365 +lon_0=-8.41 +x_0=0 +y_0=0 +ellps=WGS84 +units=m +no_defsNow when you set the Project CRS to this custom projection, the straight hub lines appear as curved.
Sometimes you may want to do the reverse. Create straight lines in a projection such as Azimuthal Equidistant (AEQD) projection and set your project to a geographic projection to make them appear curved.

Next, I wanted an animation where the points appear to move from source to destination. One can use the ‘Extract vertices‘ algorithm on the densified hub lines layer to get a point layer. The point layer would have an attribute ‘vertex_index‘ which goes from 0 (source) to 10 (destination) that can used to animate the layer. The algorithm also adds an attribute called ‘angle’ which is the bisector angle of the vertex for original geometry. This angle is useful to orient the symbol so it is pointed towards the destination. For this angle to be correct in the orthographic CRS, we must re-project the densified hub lines to that projection before extracting the vertices. Once re-projected, you can run the ‘Extract vertices’ algorithm to get the nodes.

I next added a background layer from Natural Earth (ne_10m_land) and added a SVG symbol of a place to style the vertices layer. It is important to set the ‘Rotation‘ of the SVG symbol to a data defined property with the value of the ‘angle’ field so it is oriented correctly.

I used the Time Manager plugin to create a frame per each ‘vertex_index’ of the vertices layer.

A trick is to set the ‘Time frame start’ to 1969-12-31 23:59:59 to have the first frame without any points rendered. Once the export completed, I had 13 individual images for each step of the animation. I used ImageMagick’s ‘convert‘ command to create an animated GIF.
convert -loop 0 -delay 100 frame*.png out.gifWhile I was experimenting with this visualization, I created many versions of this map, with differing number of vertices, projections etc. I found it useful to create a Processing Model of this workflow so I can tweak parameters and see the results without going through each step everytime. Here’s a snapshot of my model. There were some additional steps involved after ‘Extract Vertices’ algorithm to add a unique field to the layer so it can be saved to a geopackage. I strongly recommend a model-based workflow when you are working on QGIS projects. It saves you a lot of time and serves as a good documentation for the project so others can reproduce your results.

thanks for this – I needed somethign similar to simulate flight paths